Last month, the article on benchmarking reviewed its definition and the importance to business operations. This article will highlight the metrics of the process as it compares actual numbers.
Wikipedia defines benchmarking as “the process of comparing one’s business processes and performance metrics to industry bests or best practices from other industries. Dimensions typically measured are: quality, time, and cost. In the process of benchmarking, management identifies the best firms in their industry, or in another industry where similar processes exist, and compare the results and processes of those studied (the “targets”) to one’s own results and processes. In this way, they learn how well the targets perform and, more importantly, the business processes that explain why these firms are successful.
THE BENCHMARKING PROCESS
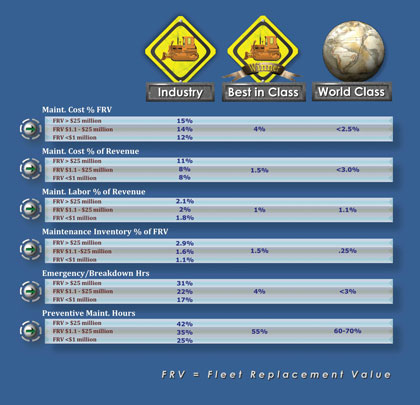
The process of benchmarking includes five recommended steps: (1) determine what to benchmark, (2) form a team, (3) identify partners, (4) collect and analyze data, and (5) implement and monitor results. Let’s skip the first three steps and focus on step four: collect and analyze data and take a closer look at the chart provided.
To facilitate the process, we are providing the numbers that were recently updated to help you compare your costs and performance practices to those in your industry, those Best in Class in your industry, and those in the World Class across all industries. This means leading and lagging indicators. Leading indicators are used to predict changes before they occur, while lagging indicators measure changes after they’ve occurred.
Most of the costs measures shown are against Fleet Replacement Value (FRV). In other words, what would it cost, at today’s prices, to replace your fleet? This may be the insured value or market value, but it is not the depreciated value. The column to the far left is the Key Performance Indicator (KPI) showing the variances in different fleet values. The next column to the right of that is the industry numbers (by size of fleet value). The numbers to the right of that column are the Best in Class within the industry (heavy construction and mining). The far right column has the World Class numbers across all industries. Maintenance costs include all maintenance costs except depreciation and fuel. This includes: labor, all parts and materials, lubrication, grease, shop operating costs (utilities and building costs). It would consist of all maintenance leadership and support costs as well.

AN EXAMPLE
For example, maintenance costs for Alpha Beta Construction are $6.2 million annually for a fleet of 435 pieces of rolling stock (on-road and off-road). Their fleet is valued at $73 million. So their costs as a percent of FRV are 8.5 percent compared to the Industry number of 15 percent. They are below the Industry Average. However, if we compare them to the Best in their Industry at 4 percent, they are double and almost 3.5 times that of the World Class number. This means, an aggressive maintenance improvement effort could bring that spending in under $3 million per year with a net of $3 million to the bottom line. Is it worth it?
So, there are some savings opportunities here by improving their maintenance practices. Now, let’s examine their other numbers and we may see why their costs are so high. Their PM percentage (total maintenance hours) is only 9 percent compared to 42 percent in the Industry Average and 55 percent against Best in Class. Their Emergency percentage is 62 percent compared to the Industry Average of 31 percent and Best in Class of 4 percent. A highly reactive maintenance process with low levels of PM and a large valued fleet means higher costs to the organization. Therefore, there is an opportunity at Alpha Beta Construction to implement a robust PM program involving not only the mechanics/techs, but vendors and operators.
By comparing and knowing the numbers, a company can benchmark how they are doing against others help drive them to improve. Benchmarking allows for “calibration” of practices, processes, and cost of performing those activities. ■
About The Author:
Preston Ingalls is president and CEO of TBR Strategies, LLC, a Raleigh, North Carolina-based maintenance and reliability firm specializing in the construction and oil and gas industries. Preston can be reached at pingallls@tbr-strategies.com, or visit www.tbr-stratigies.com.
_________________________________________________________________________
Modern Contractor Solutions, March 2013
Did you enjoy this article?
Subscribe to the FREE Digital Edition of Modern Contractor Solutions magazine.

The Analysis of Benchmarking – Part 2


